Hydroviz creates interactive visual displays of modeled hydrological alternatives to help decision-makers and interested parties understand the consequences of water management decisions.
Hydroviz
How will a proposed change to dam operations affect migrating fish or nesting shorebirds? What will happen to the industries and farmers that rely on flow releases for navigation or irrigation? Is there a flood risk for properties downstream? How will cultural values be affected? How do predicted consequences vary under different climate scenarios?
Decisions about water management in multi-use river and lake systems are inevitably complex and controversial. Demands for drinking water, industrial development, irrigation, and flood control compete with critical ecological needs and cultural values. Climate change is heightening the challenge as critical shortages and extreme conditions become commonplace. Making water management choices involves trade-offs across competing values, as well as across sites and over time. The complexity of the data involved in predicting and reporting outcomes can be overwhelming for stakeholders and decision makers.
Hydroviz leverages the knowledge gained through large- and small-scale water-use planning projects with the power of modern cloud-based technologies to make hydrological data more accessible than ever.
With Hydroviz, you identify the performance outcomes you care about – the values and indicators you want to manage for – and the management scenarios you are considering. From there, Hydroviz tells you what is likely to happen to the things you care about under each scenario in a simple, interactive dashboard. This information can be made available to stakeholders, regulators, and decision makers anywhere, anytime. Custom visualization capabilities make raw data meaningful for a wide range of users, regardless of their technical expertise. All of this builds the shared understanding that allows for more effective engagement, collaboration, and decision making.
Compass has developed and applied Hydroviz on some of the largest water systems in North America, including the Columbia, the Missouri, and the Peace-Athabasca River systems, as well as a range of hydroelectric facilities throughout British Columbia.
“Hydroviz empowers stakeholders to explore alternatives in terms of their specific interests and at their leisure. It has become an essential tool for communications among the USACE, other agencies, and stakeholders.”
– Dr. Craig Fischenich with the US Army Corps of Engineers
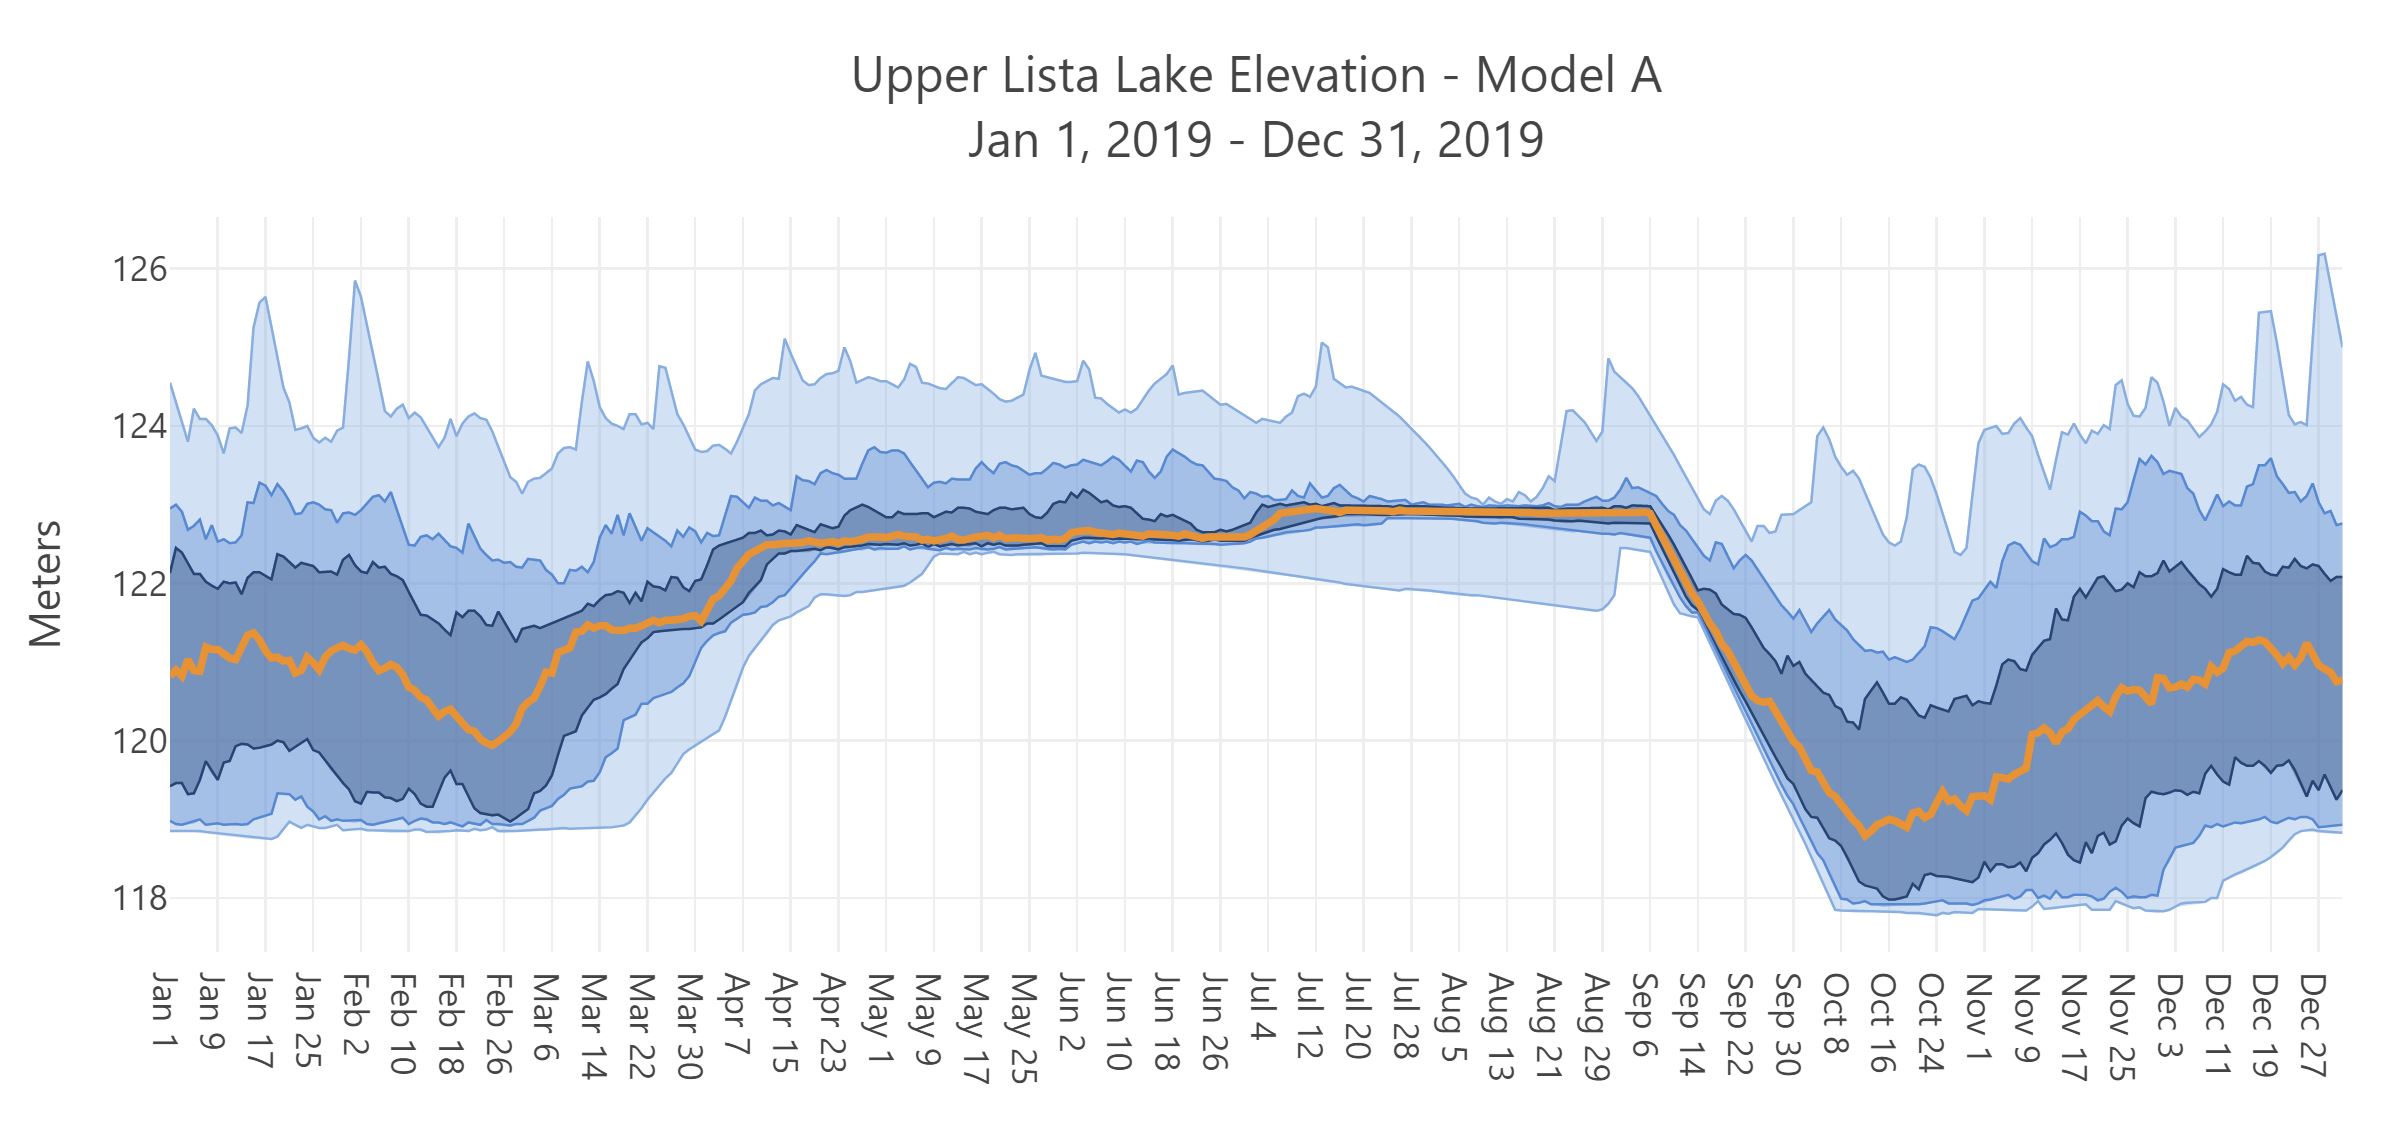
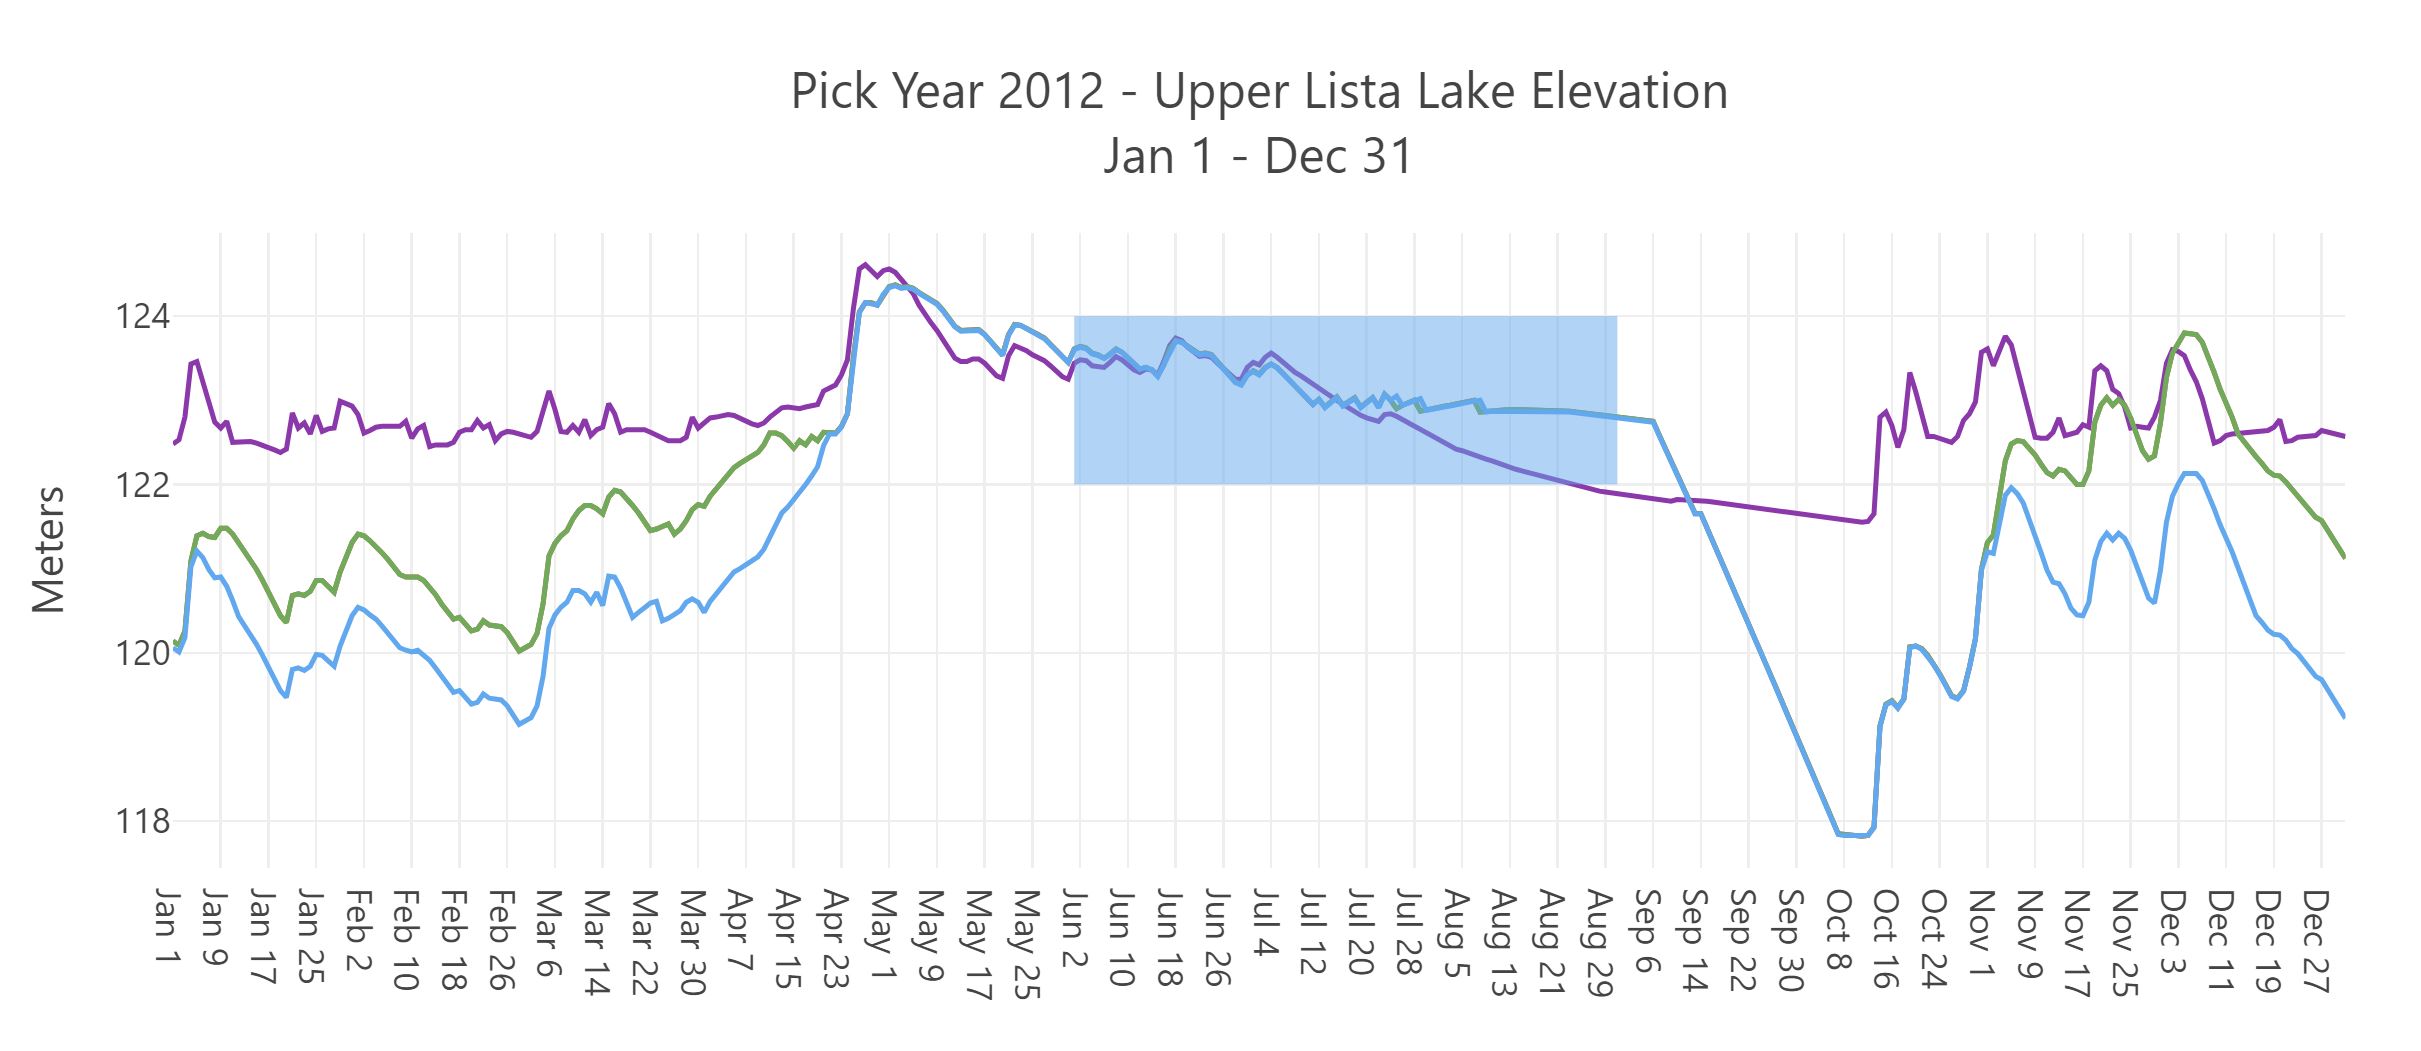
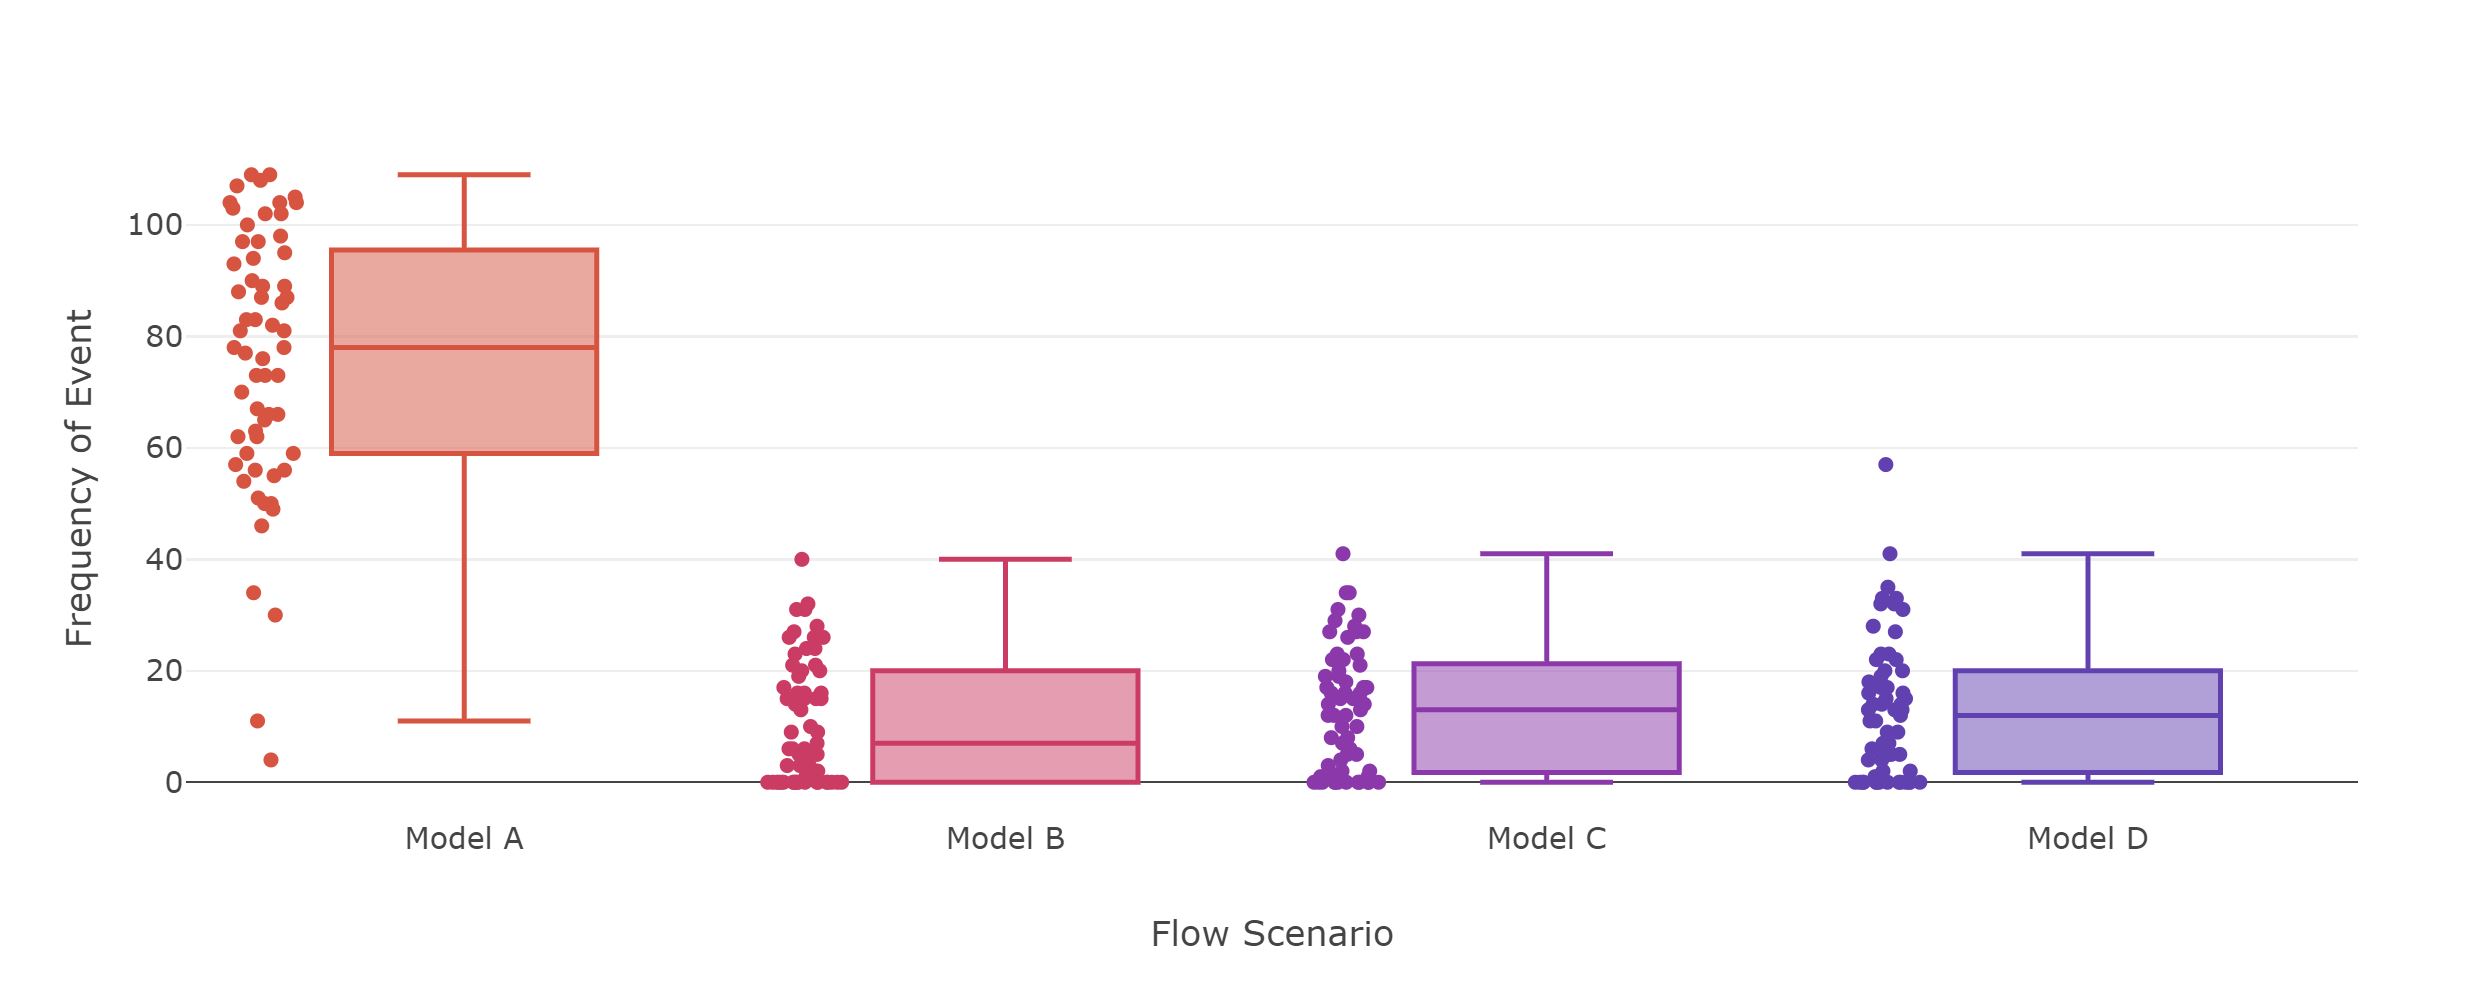
Interactive Charts
Interactive Maps
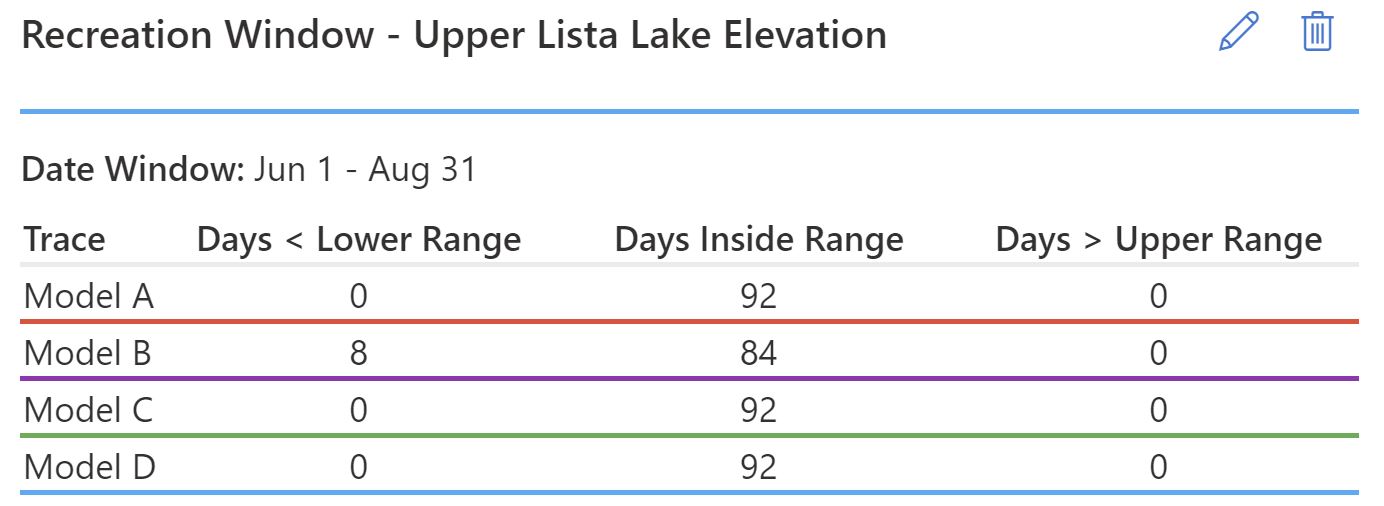
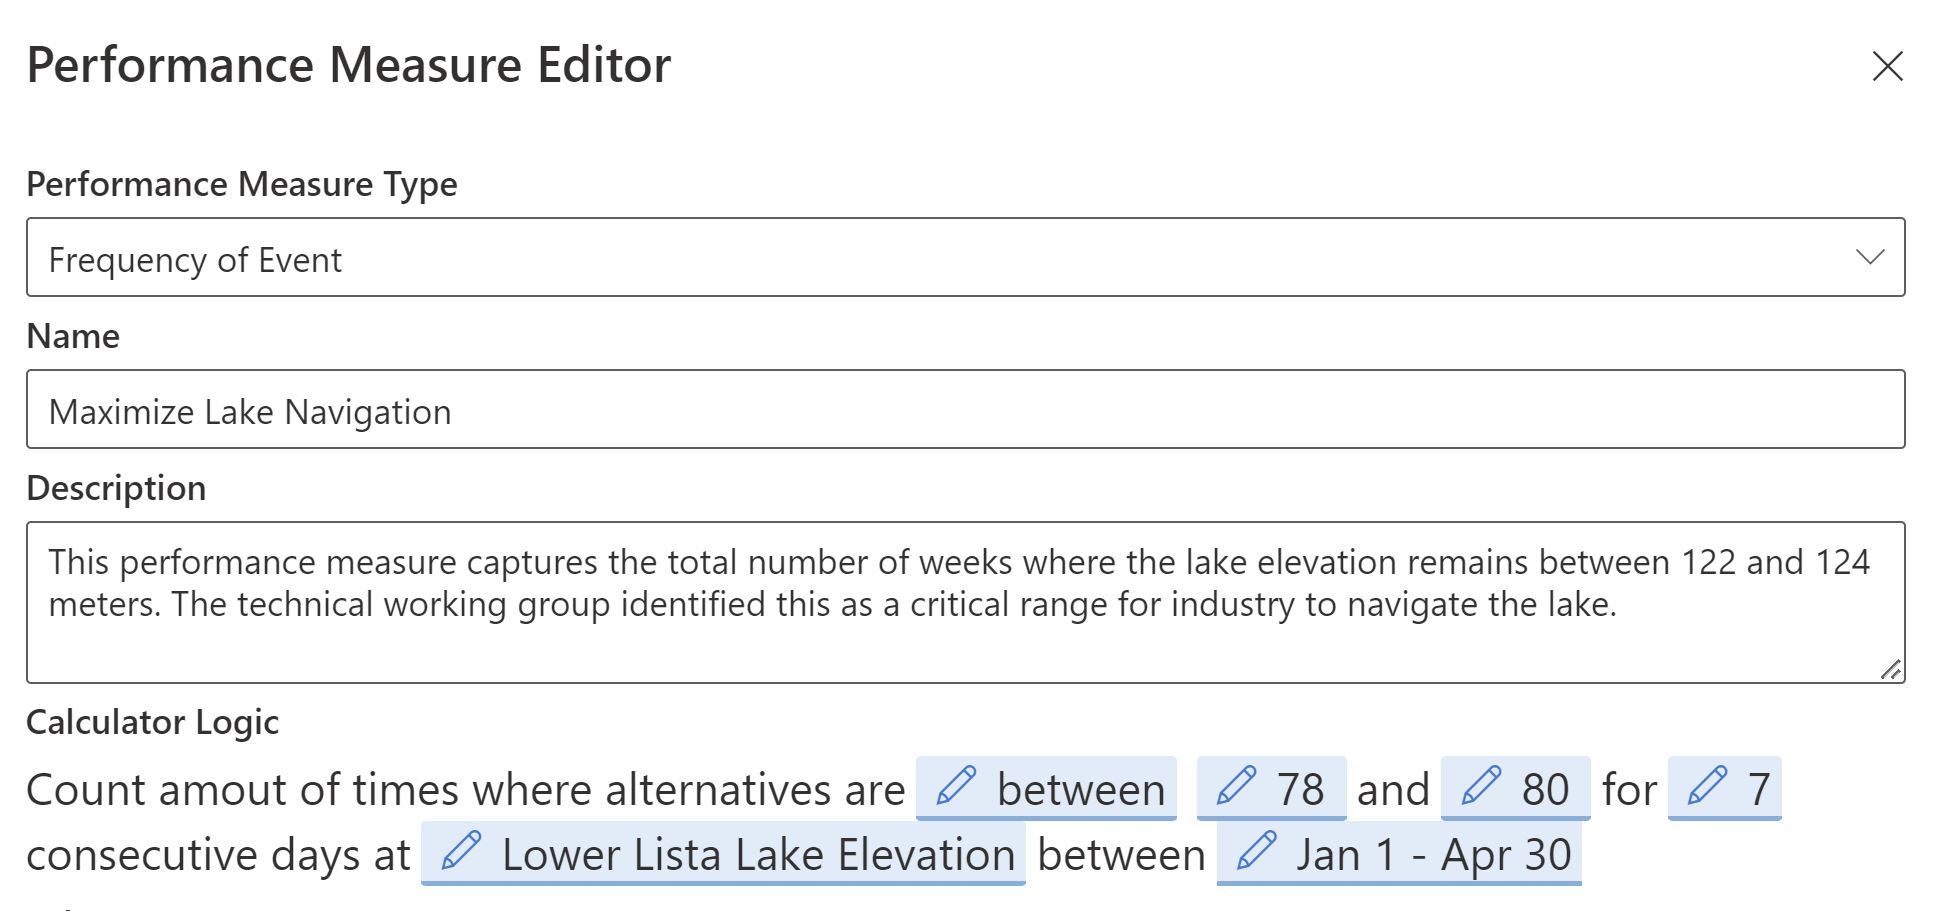
Define Thresholds
Performance Measures
Contact Us
If you think Hydroviz could help you make better water-management decisions, contact us.